The 2022 Tonga Lamb explosive energy is comparable to that of the 1883 Krakatoa.I think this refers to audio that is not heard by living creatures (sub-audio.)
The eruption is the largest event ever detected by CTBTO infrasound sensors.
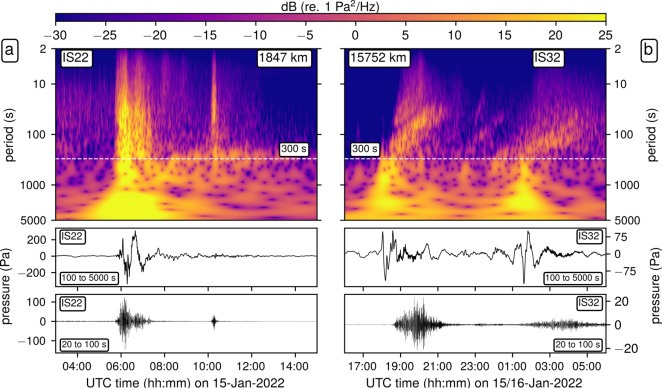
Coherent infrasound and acoustic-gravity waves show periods from ∼1 h to a few Hz.
The 15 January 2022 Hunga, Tonga, volcano's explosive eruption produced the most powerful blast recorded in the last century, with an estimated equivalent TNT yield of 100–200 megatons. The blast energy was propagated through the atmosphere as various wave types. The most prominent wave was a long-period (>2000 s) surface-guided Lamb wave with energy comparable to that of the 1883 Krakatoa Lamb wave; both were clearly observed by pressure sensors (barometers) worldwide. Internal gravity, acoustic-gravity, and infrasound waves were captured in great detail by the entire infrasound component of the International Monitoring System (IMS). For instance, infrasound waves (<300 s period) were seen to circumnavigate Earth up to eight times. Atmospheric waves captured by the IMS infrasound network and selected barometers near the source provide insight on Earth's impulse response at planetary scales.
The Hunga Tonga-Hunga Ha'apai volcano (hereafter referred to as Hunga) is a largely submerged volcano in the Tonga-Kermadec volcanic arc that formed by the westward subduction of the Pacific plate below the Indo-Australian plate. The volcanic cone rises from a depth of approximately 2,000 m below sea level and culminates with a summit caldera measuring 4 km times 2 km and reaching a mean depth of 150 m (Cronin et al., 2017). The caldera reaches the surface into the uninhabited islands of Hunga Tonga and Hunga Ha'apai, approximately 65 km north from the Tonga capital city.
The activity of this volcano remained mostly undetected before the Surtseyan eruptions that occurred in 2009 (Vaughan and Webley, 2010) and 2014 (Cronin et al., 2017). Based on estimates from satellite observations, the 2009 eruption drove ash plumes up to altitudes of 7.6 km and released a total amount of 0.0176 km3 erupted material, resulting into a Volcanic Explosivity Index (VEI) 2 eruption (Vaughan and Webley, 2010). The 2014–2015 activity lasted for five weeks and was characterized by eruptive clouds rich in gas, reaching altitudes up to 10 km (Global Volcanism Program, 2022). Each of these eruptions caused an increase of emerged material and formation of new land, rapidly eroding afterwards. Samples collected on nearby islands provided evidence of highly explosive deposits dating approximately 1000 yr ago, suggesting that the collapse of Hunga volcano that generated the existing caldera might have driven the 1108 CE tropical eruption that produced more than 1 °C global cooling (Sigl et al., 2015).
After weeks of mildly sustained volcanic activity, Hunga entered a strong eruptive phase reaching a climax on 15 January 2022 at around 04:15 UTC. The rapidly rising ash cloud reached an altitude of 58 km while developing an umbrella cloud around 30 km altitude, as reported by NASA (National Aeronautics and Space Administration) Earth Observatory (Image of the Day for 17 February 2022). Within 2 h from the onset, it spread to a 600 km diameter before being distorted from the wind, indicating a large eruptive potential (Global Volcanism Program, 2022). The event was globally recorded on seismic stations as a long-lasting (∼6000 s) wave train of long-period seismic surface waves (Poli and Shapiro, 2022). From the explosive source impulse derived from globally detected surface waves, Poli and Shapiro (2022) estimated a downward vertical force ∼2.5 larger than that of the 1980 Mt. St. Helens eruption, even though more complex models might better capture the force evolution for eruptions. The corresponding VEI is 5.8, ranking the Hunga eruption among the most energetic events recorded during the last century. The explosive eruption excited different atmospheric wave modes (infrasound, Lamb, and internal gravity waves) spanning from ∼1 h period until audible, propagating at global ranges and reaching the upper atmosphere layers (Matoza et al., 2022). The large-amplitude Lamb waves generated forerunner tsunamis propagating at ∼310 m/s, which were measured worldwide – even in the Atlantic and the Mediterranean – and preceded the tsunami generated at the source in the Pacific region (Andrews, 2022). The interaction of atmospheric Lamb and gravity waves with the tsunami wave resulted in a longer-lasting tsunami than the earthquake-induced counterparts (Andrews, 2022).
Atmospheric waves were recorded by various observation networks, including the infrasound, seismic, and hydroacoustic stations of the International Monitoring System (IMS). The Comprehensive Nuclear-Test-Ban Treaty Organization (CTBTO) has been operating the IMS for 25 yr (Mialle et al., 2019). The IMS comprises four sensor technologies: seismic, hydroacoustic, infrasound (SHI), and radionuclides. The purpose of this network is to detect, identify, and locate nuclear explosions which would detonate underground, underwater, or in the atmosphere. Upon completion, the IMS will consist of 321 stations, of which 60 infrasound stations will monitor the atmosphere. Events other than nuclear explosions generating strong infrasound signals can be either of anthropogenic origin, like accidental explosions (e.g., Vergoz et al., 2019) and rocket launches (e.g., Pilger et al., 2021), or of natural origin other than volcanoes, like meteoroid events (e.g., Le Pichon et al., 2013). According to the Reviewed Event Bulletin (REB) released by CTBTO's International Data Center (IDC), all 53 IMS infrasound stations operational at the time of the Hunga explosive eruption recorded signals from the event, alongside 4 hydroacoustic hydrophone triplets and over 20 seismic IMS stations, making this the largest event ever recorded by the IMS infrasound stations and surpassing the Chelyabinsk 2013 airburst (e.g., Le Pichon et al., 2013).
Lamb waves induced by nuclear tests in the atmosphere were extensively used to estimate their yield (Pierce and Posey, 1971) in TNT (TriNitroToluene) equivalent, where 1 kiloton TNT = 4.184 × 10¹² Joule. Such an approach has also been used to infer major explosive eruption yield, leading to 35 megatons (MT) TNT equivalent for the 1980 Mt. St. Helens eruption (Donn and Balachandran, 1981) and 70 MT for the 1991 Pinatubo eruption (Tahira et al., 1991). A maximum yield of 100–150 MT was estimated for the 1883 Krakatoa eruption (Harkrider and Press, 1967), far larger than the maximum yield of ever detonated nuclear tests (50 MT; Stevens et al., 2002).
This paper provides a comprehensive description of the chronology of the Hunga eruption as observed by the IMS technologies. The IMS infrasound network and different atmospheric wave modes are introduced in Section 2. Section 3 describes the infrasound data processing and introduces the applied methods for estimating the Hunga eruption yield. The infrasonic and acoustic-gravity waves observed across the entire IMS infrasound network as well as the unique features of the global atmospheric wave observations are described in Section 4. Potentially limiting aspects of the yield estimate and a comparison of Hunga volcano with historical eruptions are discussed in Section 5.
The entire IMS infrasound network, currently consisting of 53 certified stations, detected the Hunga explosive eruption. Besides infrasound, these stations also enabled global observations of Lamb waves. Fig. 1 shows the station locations and the modeled arrival times of both wave types using celerities estimated from the atmospheric conditions (see Supporting Information SI1). The nomenclature used for the identification of the different wave passages follows Matoza et al. (2022): A1 for the direct short-orthodrome arrival, A2 for the first long-orthodrome arrival, A3 for A1 plus one circumnavigation, etc.
The soliton-like wave which traveled around the Earth corresponds to the Lamb wave solution (e.g., Lamb, 1932). It emerges from the governing AGW equations when the vertical velocity is set to zero.
I think I read one of his books a long time ago. I had no idea he was into volcanics. It was just an old weather book. How come they haven’t cracked it all wide open by now?
In case you never noticed the planet Venus was occluding Earth as Pluto aligned. A Lamb Wave might best be drawn as a colour flag showing the time it took to propagate. Come to think of it. Why does USGS only use three colours for 30 days of quakes?
That is stupid multiplied by multiple exponentials!
Joan Alexander, a Colorado-based senior research scientist at NorthWest Research Associates, sees ripples like this every day above thunderstorms around the world, “but they are never this large of an extent of a pattern,” she said. “They’re never as strong as this.”
While it’s clear that the volcano generated the waves, scientists are curious about which specific phenomenon was responsible. It could have been the volcano’s massive belch of heat into the atmosphere, the sudden onslaught of latent heat by condensation, or the hurtling vertical velocity from the explosion (the volcanic cloud shot 39 kilometers into the atmosphere, preliminary calculations estimated). “It’s probably a mixture of things,” Alexander said.
Physicist Cathryn Mitchell at the University of Bath even saw the waves reaching into the ionosphere, a region that extends between the mesosphere and the thermosphere. She pulled from multiple ground and space-based sensors to plot the ionosphere’s total electron content over time


> scientists are curious about which specific phenomenon was responsible
I'll bet they are.
And yet they measured it accurately to within many thousands of tons of TNT